Table of contents
ZRM for MySQL generates a number Predefined backup reports you can easily customize. ZRM for MySQL automatically generates backup reports after each backup run is completed.
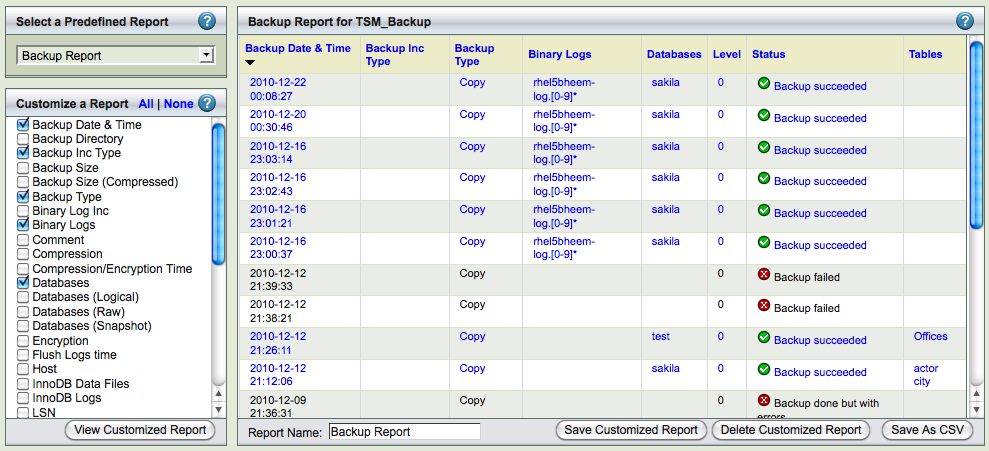
The Custom Reports Tab displays a list of predefined reports, along with checkboxes that allow customized displays. It is divided into two panels.
- The left panel shows a list of predefined reports; beneath this list is a series of checkboxes that let you customize the display.
- The right panel displays the Report itself.
Select a Predefined Report

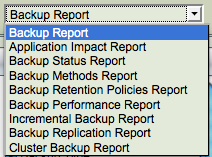
Click the Select a predefined report dropdown menu and choose from the list of available reports. The selected report is displayed in the right panel.
- Note
- Besides displaying the report for the current date, you can view earlier reports by using the vertical scroll bar.
Customize Report

Check additional field names (or un-check ones that are already displayed) to customize the report display. You can also change the sort order by clicking the report columnn headers.
Because a large number of fields can extend beyond the display, a horizontal scroll bar appears in the right panel when required.
Save as CSV
This Save as CSV button allows users to save custom reports in CSV format. This format can be read by any spreadsheet or report analysis tool. Before saving a custom report as CSV, you must name the report using Save Customized Report. The CSV output is saved in a file named zrm3_1-<custom report name>.csv
Links in Custom Reports

All successful backups have a link to the restore pages. In the example above, the first four rows display links because the backups were successful. All the text in various columns of these two rows is colored linked blue. Clicking any text follows the link.
When any link is clicked, ZRM for MySQL jumps to the Restore What page with the date and time filled in based on the backup you selected from the report. For further details about the Restore What page, see here.
Predefined Reports
The predefined reports are shown and described below. The reports are shown displaying the default columns; you can customize each of the reports to display the desired column fields. The Backup Date and Time column is common to all the reports. It identifies and differentiates between different Backup Runs of the same backup set. A few key columns are discussed below.
Backup Report

The Backup Report has columns that display Level, Database and Tables, corresponding to the Backup What parameters. It also has a column that shows the status of the run.
Application Impact Report

The Application Impact Report displays the Read Lock Time and Total Time for each run. These allow you to determine how the backup run affected database application performance.
Backup Status Report

The Backup Status Report displays the Status and the Destination Directory where the data has been backed up. The Status of the run is also displayed.
Backup Method Report

The Backup Method Report displays the backup method (i.e. Databases Logical, Databases Raw and Snapshots) used to create the backup. The data in these columns will not change across runs. By changing the backup set selection in the drop down box at the top of the page, can quickly see which backup sets have what methods.
Backup Retention Policy Report

The Backup Retention Report shows the retention policy for the backup set. A blank column indicates that no purge policy has been set for the backup set.
Backup Performance Report

The Backup Performance Report displays compression and performance statistics for the backup set.
Incremental Backup Report

The Incremental Backup Report shows the kind of backup performed: Incremental Backup Sets will display a value, while full backups display a blank column.
Replication Backup Report

The Replication Backup Report has two columns. 'Replication Files' and 'Slave Load Files' show values when Replication has been set for the backup set.
Cluster Backup Report

The Cluster Backup Report has three columns. 'NDB Backup ID' , 'NDB Connect String' and 'NDB Node List' that will show the same values until changed by the User. The Status column allows users to judge the impact of changing these parameters.