Table of contents
- 1. Custom reports
- 1.1. Predefined Reports
- 1.1.1. Backup Report
- 1.1.2. Application Impact Report
- 1.1.3. Backup Status Report
- 1.1.4. Backup Method Report
- 1.1.5. Backup Retention Policy Report
- 1.1.6. Backup Performance Report
- 1.1.7. Incremental Backup Report
- 1.1.8. Replication Backup Report
- 1.1.9. Cluster Backup Report
- 1.2. Customized Report
- 1.1. Predefined Reports
Custom reports
ZRM for MySQL & MariaDB generates a number of Predefined backup reports you can easily customize. ZRM for MySQL & MariaDB automatically generates backup reports after each backup run is completed.

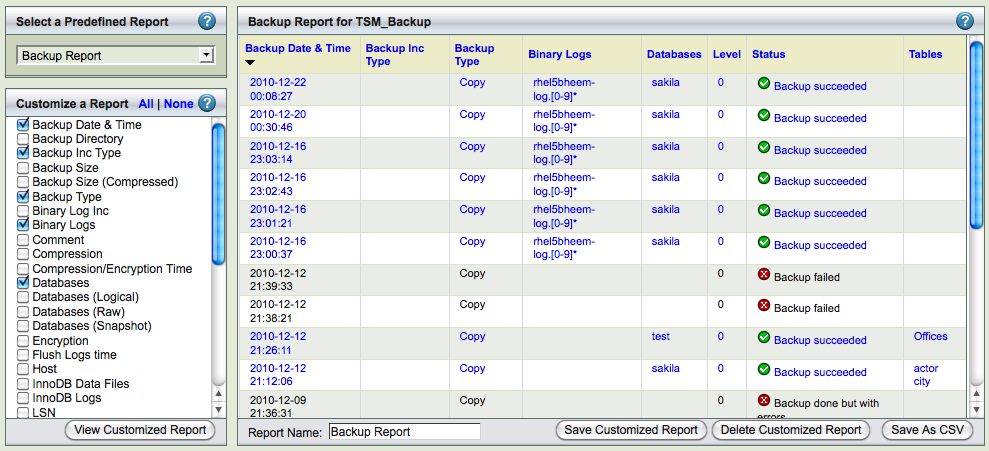
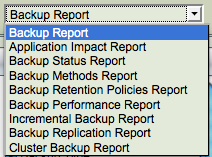
The Custom Reports displays a list of predefined reports, along with checkboxes that allow the user to customize reports.
- The left panel shows a list of predefined reports; beneath this list is a series of checkboxes that let you customize the display.
- The right panel displays the Report.
Predefined Reports
The predefined reports are shown and described below. The reports are shown displaying the default columns; you can customize each of the reports to display the desired

column fields. The Backup Date and Time column is common to all the reports. It identifies and differentiates between different Backup Runs of the same backup set. A few key columns are discussed below.
When any link is clicked, ZRM for MySQL & MariaDB jumps to the Restore What page with the date and time filled in based on the backup you selected from the report.
Backup Report
The Backup Report has columns that display Level, Database and Tables, corresponding to the Backup Whatparameters. It also has a column that shows the status of the run.
Application Impact Report
The Application Impact Report displays the Read Lock Time and Total Time for each run. These allow you to determine how the backup run affected database application performance.
Backup Status Report
The Backup Status Report displays the Status and the Destination Directory where the data has been backed up. The Status of the run is also displayed.
Backup Method Report
The Backup Method Report displays the backup method (i.e. Databases Logical, Databases Raw and Snapshots) used to create the backup. The data in these columns will not change across runs. By changing the backup set selection in the drop down box at the top of the page, can quickly see which backup sets have what methods.
Backup Retention Policy Report
Backup Performance Report
The Backup Performance Report displays compression and performance statistics for the backup set.
Incremental Backup Report
Replication Backup Report
Cluster Backup Report
Customized Report

