Table of contents
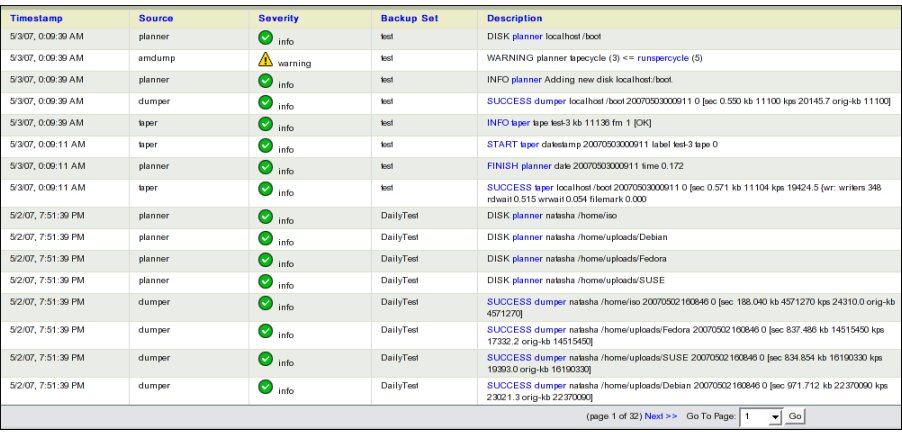
Full Page Display of Alerts/Logs
- ZMC provides Event logs so that users can look at all the events and take corrective action.
- All events are presented in a tabular form. The events can be sorted on any column by clicking the column header name. The columns are:
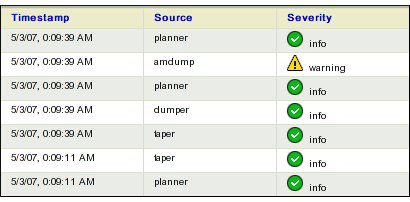
- Timestamp : Time stamp of the event
- Source : Source can be an Amanda enterprise module such as planner, amdump, taper and Zmanda Network
- Severity : Severity can be failure, warning, info. All events with error severity need immediate attention.
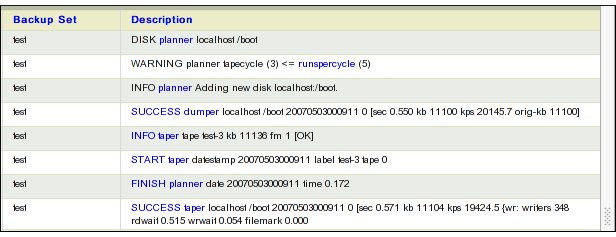
- Backup Set : Backup set name if it is an Amanda event.
- Description: Event description. The event description has hyperlinks. Clicking the hyperlinks will provide information from Knowledgebase in Zmanda network or Amanda wiki about the event, how to resolve the problem if it is an error.
- The events can be from an Amanda Enterprise module or Zmanda Network
- Amanda Enterprise Edition generates lots of events during a backup process and configuration process.
- Zmanda Network provides security and product alerts.
- Events about all backup sets are provided in the same view irrespective of the backup set selected.
- All events are retained for forever. This provides backup administrator to identify error trends across backup runs.
- Fig 1 below shows an overview of the Event Log page.
- The two Figures below, Fig 2 and Fig 3 shows the column header in the Event Logs in detail
Log Rotate Utility
- ZMC works with a logrotate utility that allows Sysadmins to effectively prune active logs.
- Sysadmins should rotate the logs using crontab
For example:
0 1 * * 1,5 logrotate /etc/logrotate.d/zmc_logrotate (For 1 AM on Monday and Friday of each week)