Table of contents
- 1. Report Data
- 1.1. Introduction
- 1.2. Report Data Page Overview
- 1.3. Report Data Page Procedure
- 1.4. Date and Legend Panel
- 1.4.1. Date and Calender Controls
- 1.4.1.1. Backup Level
- 1.4.1.2. Backup Status
- 1.4.1. Date and Calender Controls
- 1.5. Data Chart Panel
- 1.5.1. Common Navigational Aids
- 1.5.2. Other Controls
- 1.5.3. Data Displayed
Report Data
Introduction
The Report Data tab reports on backup runs for a week of a particular backup set.
Report Data Page Overview

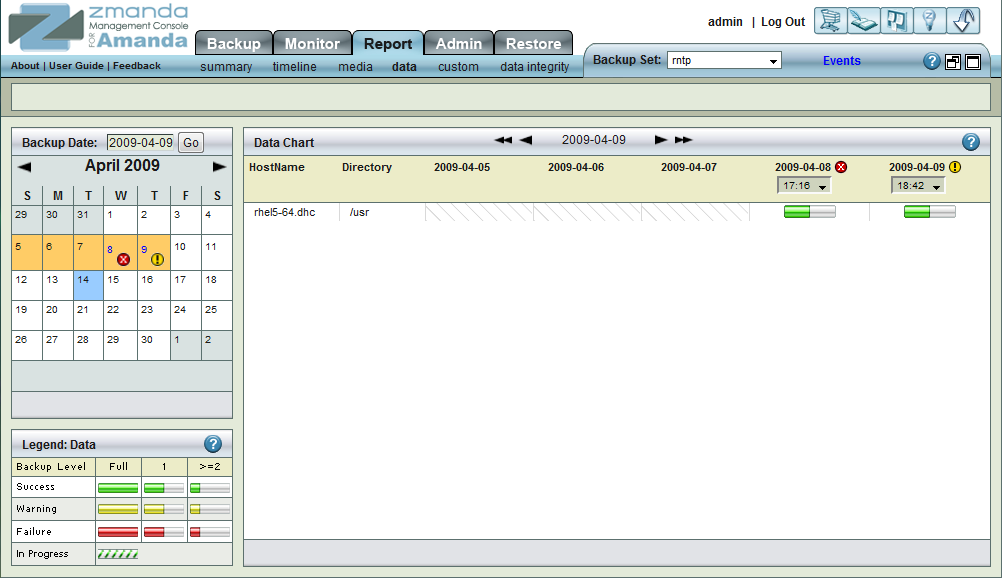
The Report Data page provides a Backup object-by-backup level view of backup runs for a week of a particular backup set. The graphical display also incorporates the backup status in its display.
Report Data Page Procedure
The Report Data page is divided into two panels:
The left panel contains a date/calendar controls and a legend that explains the report status icons.
The right panel list results for each backup object/DLE, using iconsthat show the type of backup (full or incremental) and whether t any errors or warnings were returned. The browse buttons at the top lets you scroll back and forth in time.
Date and Legend Panel
By default the Report Data page opens with the current month calender shown in the Left hand Date and Legend panel.
Date and Calender Controls
The top portion consists of a Backup Date input box along with a Go button. Clicking Go displays the given date in the Calandar. The input box accepts dates in both mm/dd/yyyy and mm/dd/yy formats.
The Calendar control at the bottom of the panel works the same as it does for the Summary Report.
Backup Level
ZMC automatically decides what level of Backup (full or incremental) is appropriate for a backup run. Full backups are labeled level 0 and incremental levels are labeled 1 or 2 and higher levels. When ZMC runs the backup, users are not aware of the level at which it has run. NB: While, immediate backups can be enforced from the Backup Activate page, that does not mean that Immediate Backups are Full backups! ZMC takes its own decision as to the appropriate level while running the Immediate Backup. Level 0 is shown by a long bar. Level 1 is shown by bar which is about half the size of full bar. Level 2 or above are shown by a bar which is one fourth the size of full bar. These lengths have no intrinsic meanings. Their lengths are just to differentiate them from each other.
Backup Status
ZMC labels each DLE backup as having completed as Normal, or as with Warning or with Errors. Normal status is indicated by a green color. Warnings are indicated by a yellow color. Errors are indicated by a red color. The combination of level and status gives rise to nine legends shown in the Fig. 3.
Data Chart Panel
Common Navigational Aids
The Right hand Report Data panel has the Calender Turner labeled (No 1 below). Pressing either of the two inner single arrows allows the users to change reports one day at a time. When either of the outer two arrows signs are pressed, the Calender changes by a week (seven days) at a time.
Other Controls
The Chart has additional controls shown below: Various dates are spread across the top. Each date carries with it the same legend that is shown in the Summary report. A drop down box below it allows users to choose different Backup runs on the same day, if they exist.
Data Displayed
All the DLEs that exist in the Backup Set are displayed in the two left most columns labeled 'Hostname and ' Directory' respectively. The seven dates are displayed in the next seven columns with the selected date shown in the right most position. In the cell that is formed by the inter-section of DLE and date, one of the nine legends is displayed. The display allows users to see the historical trend of a Backup Set broken into its DLEs
