Zmanda Documentation > ReportData
Table of contents
- 1. Introduction
- 2. Report Data Page Overview
- 3. Report Data Page Main Functionality
- 4. Report Data Page Procedure
- 5. Date and Legend Panel
- 5.1. Date Calender Control Sub panel
- 5.2. Legend Sub panel
- 5.2.1. Backup Level
- 5.2.2. Backup Status
- 6. Data Chart Panel
- 6.1. Common Navigational Aids
- 6.1.1. Calender Turner
- 6.1.2. Minor Controls
- 6.2. Data Displayed
- 6.1. Common Navigational Aids
- 7. Move to...
Report Data
Introduction
- The four tabs under the Report tab collectively allow users to view backup run progress data from many perspectives.
- The Report Data Tab, the fourth of the four tabs, gives a graphical DLE-wise cum Level-wise view of the backup runs for a week of a particular Backup Set.
Report Data Page Overview
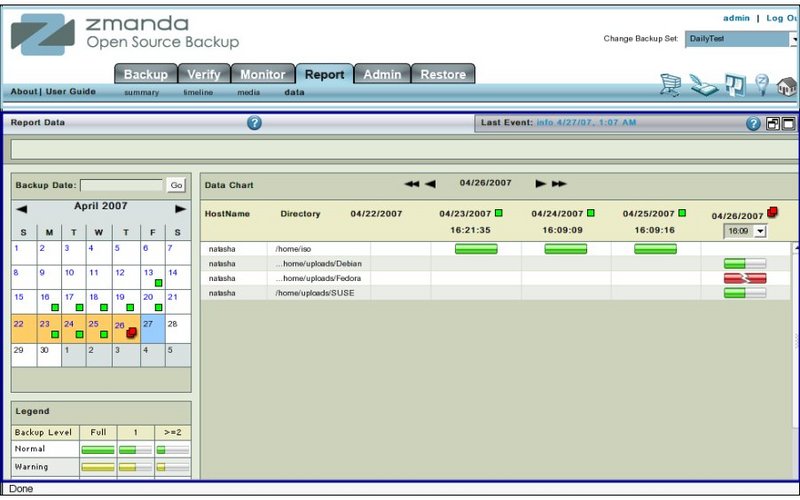
- Like all other functional pages of ZMC, the Report Data page has its main functionality in the center, while other common-to-most-pages functionalities are grouped at the top of the page.
- Explanation of common functionalities enclosed in a light blue rectangle at top in Fig. 1 can be found on Common Functionality page.
- In the image above,the main functionality area is enclosed in the lower Navy Blue rectangle.
Report Data Page Main Functionality
- The main functionality of the Report Data page is to give users a DLE-wise cum Level-wise view of the backup runs for a week of a particular Backup Set.
- The graphical display also incorporates the backup status in its display.
Report Data Page Procedure
- The Report Data page is visually divided into two panels just as the other Report pages are.
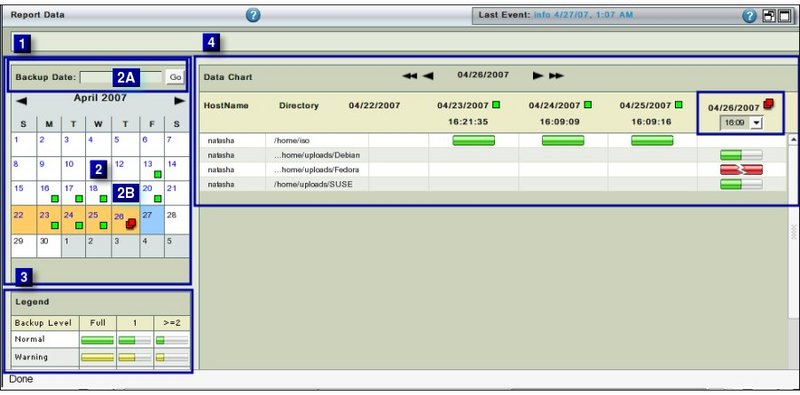
- The Left hand panel (No 1 above) contains a Calender control sub panel(No 2 above) and a Legend sub panel (No 3 above).
- The Right hand panel (No 4 above) mainly contains a graphical visualization of a DLE-wise cum Level-wise view of the backup runs for a week of a particular Backup Set.
- It also has a Calender Turner aid at the top.
- This aid is common to all the four pages of Report Tab.
Date and Legend Panel
- By default the Report Data page opens with the current month calender shown in the Left hand Date and Legend panel.
Date Calender Control Sub panel
- The top portion (No 2A in Fig. 2) consists of a Backup Date input box along with a Go button.
- The input box accepts dates in both mm/dd/yyyy and mm/dd/yy formats.
- After the date has been entered in the input box,users can press the Enter button on their keyboard or click the Go button on the screen to reach to that date in the Calender Control.
- The Report Data , if any, for that date will be displayed in the Right hand panel at the extreme right position.
- In addition, similar data for the previous six days to the day selected will also be displayed.
- The bottom portion (No2B in Fig. 2) consists of the Calendar Control.
- The Calendar control functions in the usual manner. Its enhancements are explained here
- Cells of individual dates display a Legend similar to the Report Summary page.
- They do not display the Legends that are used in displaying the Data itself.
Legend Sub panel
- The Legend displays the backup status in horizontal rows.
- The Legend displays the backup level in vertical columns.
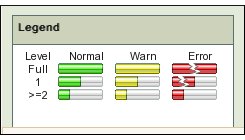
- Overall there are nine different legends, three each for the level and three each for the status.
Backup Level
- ZMC automatically decides what level of Backup (full or incremental) is appropriate for a backup run.
- Full backups are labeled level 0 and incremental levels are labeled 1 or 2 and higher levels.
- When ZMC runs the backup, users are not aware of the level at which it has run.
- NB: While, immediate backups can be enforced from the Backup Activate page, that does not mean that Immediate Backups are Full backups!
- ZMC takes its own decision as to the appropriate level while running the Immediate Backup.
- Level 0 is shown by a long bar.
- Level 1 is shown by bar which is about half the size of full bar.
- Level 2 or above are shown by a bar which is one fourth the size of full bar.
- These lengths have no intrinsic meanings. Their lengths are just to differentiate them from each other.
Backup Status
- ZMC labels each DLE backup as having completed as Normal, or as with Warning or with Errors.
- Normal status is indicated by a green color.
- Warnings are indicated by a yellow color.
- Errors are indicated by a red color.
The combination of level and status gives rise to nine legends shown in the Fig. 3.
Data Chart Panel
Common Navigational Aids
- The Right hand Report Data panel has the following navigational aids
Calender Turner
- This is labeled (No 1 below) and pressing either of the two inner single arrows allows the users to change reports one day at a time.
- When either of the outer two arrows signs are pressed, the Calender changes by a week (seven days) at a time.
Minor Controls
- The Chart has additional controls shown below:
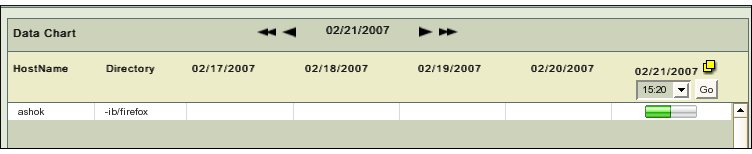
- Various dates are spread across the top.
- Each date carries with it the same legend that is shown in the Summary report.
- A drop down box below it allows users to choose different Backup runs on the same day, if they exist.
Data Displayed
- All the DLEs that exist in the Backup Set are displayed in the two left most columns labeled 'Hostname and ' Directory' respectively.
- The seven dates are displayed in the next seven columns with the selected date shown in the right most position.
- In the cell that is formed by the inter-section of DLE and date, one of the nine legends is displayed.
- The display allows users to see the historical trend of a Backup Set broken into its DLEs
Move to...
- There is no dependency linked to this page.
- Users are free to move wherever they like.
- Many times users will move to other Report pages to get a different perspective on the data.
- Occasionally users will want to visit the Event Log View page to see the full details of the backup run that has Warnings/Errors.